| SHELTER |
Maximum
Population (approximate) |
Opening Date |
Closing Date |
Days Open |
| US Naval Air Station, Belle
Chasse |
2000 |
16 August |
20 August |
4 |
| Belle Chasse High School |
1700 |
16 August |
1 September |
15 |
| Scottville High School |
800 |
16 August |
1 September |
15 |
| Port Sulphur High School |
105 |
20 August |
31 August |
11 |
| Buras High School |
400 |
1 September |
11 November |
71 |
| Sunrise High School |
126 |
1 September |
November 30 + |
90+ |
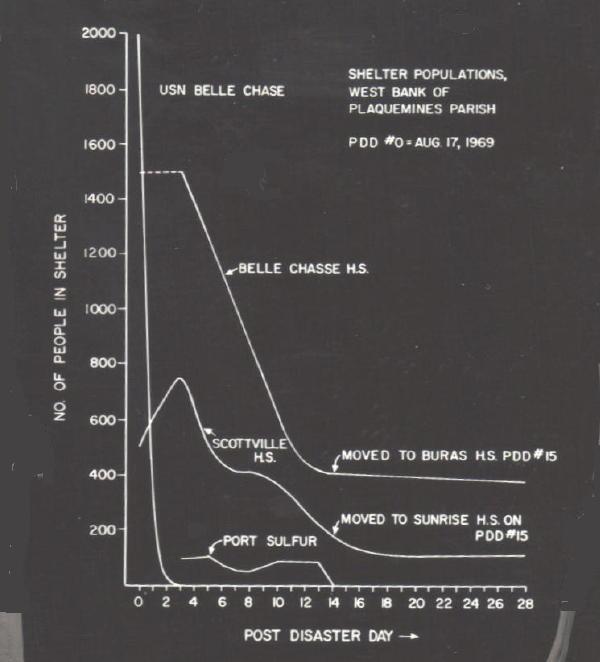 exited during the next 2
weeks, as their homes were repaired. On September 1st, the 15th
post-disaster day, the 400 remaining residents were transported to
Buras High School. By now they represented a fairly stable population,
of persons whose homes were destroyed or sustained major damage.
exited during the next 2
weeks, as their homes were repaired. On September 1st, the 15th
post-disaster day, the 400 remaining residents were transported to
Buras High School. By now they represented a fairly stable population,
of persons whose homes were destroyed or sustained major damage.| SHELTER OCCUPANCY,
Person-days; PDD = Post-disaster Day |
|||||
| SHELTER POPULATIONS (Predominant Race) |
1st Week PDD 0-7 |
2nd Week PDD 8-14 |
3rd Week PDD 15-21 |
4th Week PDD 22-28 |
1st Month PDD 0-28 |
| Belle Chasse-Buras High Schools (White) | 10750 |
4250 |
2735 |
2651 |
20386 |
| Scottville-Sunrise High Schools
(Black) |
4624 |
2220 |
889 |
815 |
8548 |
| Port Sulphur High School (White) |
440 |
556 |
0 |
0 |
996 |
| Belle Chasse Naval Air Station
(Black)* |
na |
na |
na |
na |
na |
| TOTAL |
15814 |
7026 |
3624 |
3466 |
29930 |
| Post-Disaster
Day (PDD) #0 = August 17, 1969 -- Note that first week includes 8
days; *na = occupancy not available |
|||||
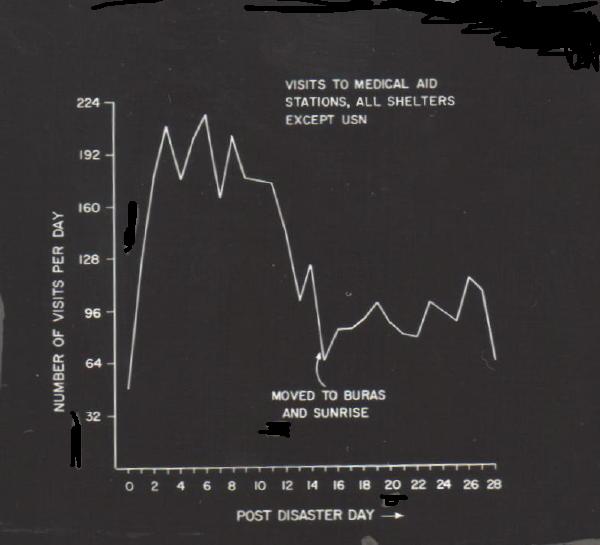
 As
indicated by the figure to the left,
demand was greatest during the 3rd
to 9th days after the storm. During this time, about 200 people
were treated daily. After the move to Buras, the number treated
averaged about 80 per day. (Click on images for enlarged view).
As
indicated by the figure to the left,
demand was greatest during the 3rd
to 9th days after the storm. During this time, about 200 people
were treated daily. After the move to Buras, the number treated
averaged about 80 per day. (Click on images for enlarged view).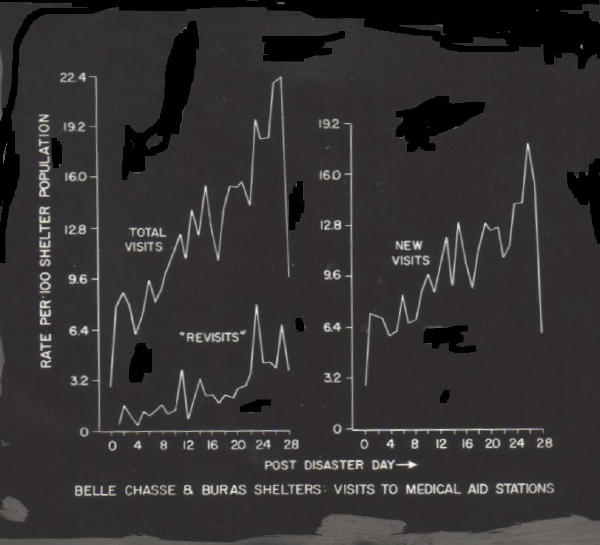
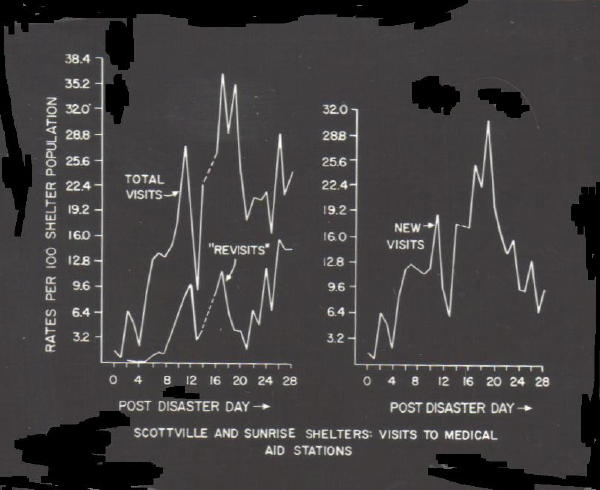 The
daily rate of visits for medical aid in the white shelter population
(shown at the left) is
seen to climb quite steadily during the first
two weeks. If revisits for the same or related complaint are
subtracted from total visits, the "new visit" rate, shown in the right
part of each graph,
averaged about 10 per hundred during the 2nd two weeks. In the
black shelter population (at
the right), the rate of visits to the
medical aid stations was much greater. Subtracting the revisits, there
was a peak of about 30 new visits per hundred during the third week
after the storm. Nearly one-third of the entire shelter
population appeared for treatment on the 19th day!
The
daily rate of visits for medical aid in the white shelter population
(shown at the left) is
seen to climb quite steadily during the first
two weeks. If revisits for the same or related complaint are
subtracted from total visits, the "new visit" rate, shown in the right
part of each graph,
averaged about 10 per hundred during the 2nd two weeks. In the
black shelter population (at
the right), the rate of visits to the
medical aid stations was much greater. Subtracting the revisits, there
was a peak of about 30 new visits per hundred during the third week
after the storm. Nearly one-third of the entire shelter
population appeared for treatment on the 19th day!| REASONS
FOR VISITS TO MEDICAL AID STATIONS, FIRST MONTH (PDD 0-28) |
||||
| CONDITION |
Belle Chasse-Buras
(White) |
Scottville-Sunrise
(Black) |
||
| New Visits |
Revisits |
New Visits |
Revisits |
|
| Acute Open Injuries |
378 |
38 |
100 |
6 |
| Acute Closed Injuries |
56 |
4 |
12 |
2 |
| Skin & Wound Infections |
170 |
71 |
131 |
61 |
| ENT & Resp Infections |
251 |
23 |
198 |
119 |
| Diarrhea |
82 |
15 |
14 |
19 |
| Non-Diarrhea Digestive |
90 |
5 |
42 |
1 |
| Headache, Nerves, etc. |
131 |
17 |
91 |
6 |
| Chronic Non-Diabetic |
53 |
32 |
51 |
22 |
| Diabetic Conditions |
20 |
70 |
21 |
6 |
| Allergic and Non-Inf Skin |
68 |
2 |
31 |
1 |
| Obstetric Conditions |
10 |
3 |
2 |
7 |
| Tetanus Shot Only |
43 |
0 |
3 |
0 |
| Birth Control Rx Only |
14 |
0 |
3 |
0 |
| Other Miscellaneous |
173 |
28 |
72 |
7 |
| No Diagnosis or Rx Recorded |
174 |
46 |
28 |
8 |
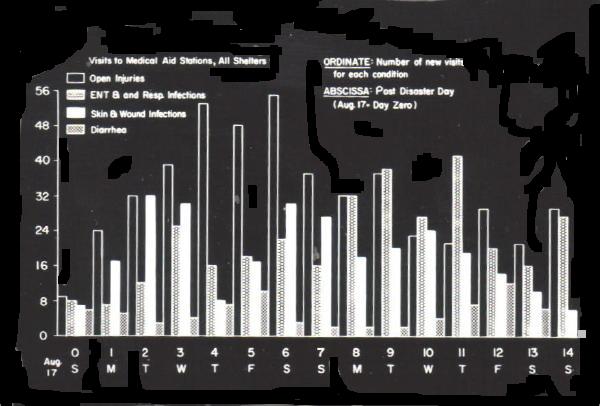
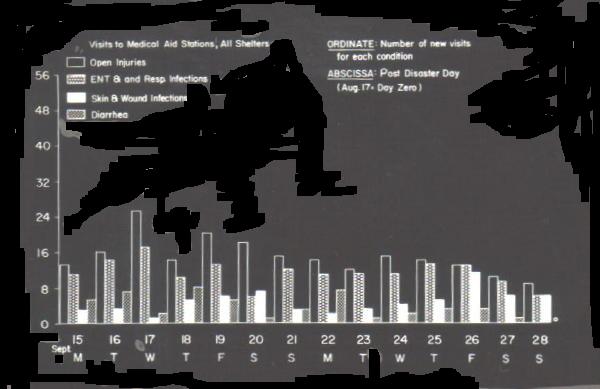 During
the 3rd and 4th weeks, injuries were fairly common, and skin infections
had become quite uncommon. Some 20 stool samples from patients with
diarrhea were negative for enteric pathogens. Beta-hemolytic
streptococci were recovered in only 12 of 180 throat cultures. These
charts reflect the overall demand for medical aid for the four
conditions during the frrst 2 weeks (to the left) and the second 2
weeks (to the right).
During
the 3rd and 4th weeks, injuries were fairly common, and skin infections
had become quite uncommon. Some 20 stool samples from patients with
diarrhea were negative for enteric pathogens. Beta-hemolytic
streptococci were recovered in only 12 of 180 throat cultures. These
charts reflect the overall demand for medical aid for the four
conditions during the frrst 2 weeks (to the left) and the second 2
weeks (to the right).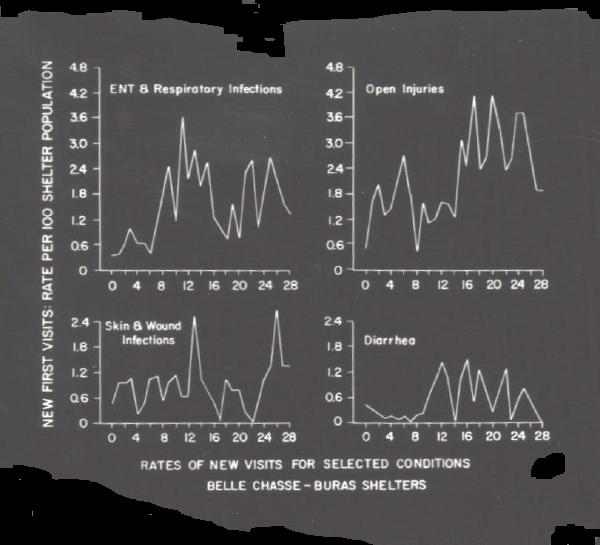 In
the white shelter population (displayed to the left),
respiratory
infections appeared in two waves, with peaks around the llth and 24th
days. Injuries exhibited two levels of occurrence. During
the first 2 weeks after the storm, injuries occurred in about 1.5% of
the population each day. During the 2nd two weeks, they reached a
plateau at about twice that level. Remember that the move to
Buras brought the population right into the area of destruction. Skin
and wound infections were distributed rather evenly in the white
population. Diarrhea incidence was greatest during the second and
third weeks.
In
the white shelter population (displayed to the left),
respiratory
infections appeared in two waves, with peaks around the llth and 24th
days. Injuries exhibited two levels of occurrence. During
the first 2 weeks after the storm, injuries occurred in about 1.5% of
the population each day. During the 2nd two weeks, they reached a
plateau at about twice that level. Remember that the move to
Buras brought the population right into the area of destruction. Skin
and wound infections were distributed rather evenly in the white
population. Diarrhea incidence was greatest during the second and
third weeks. 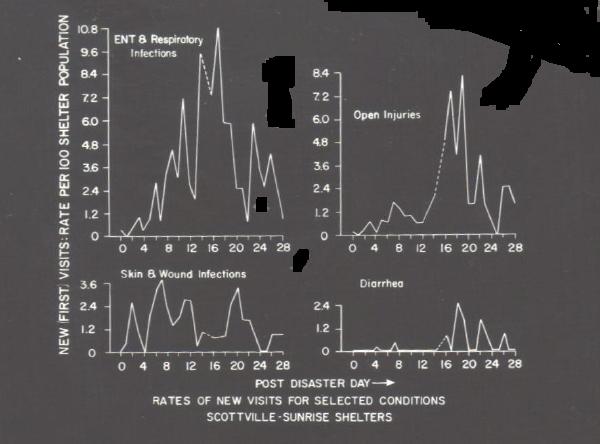 The
black population (chart on the left)
had quite a different
pattern of illness. Initially, the respiratory infection rate increased
in the same manner as in the whites, but the epidemic continued, to
peak later, at about the l?th day. A. normal, rather than a bimodal
distribution, was assumed. Open injuries occurred at a very low
rate during the first two weeks. After the move to Buras, injuries
increased greatly, up to about 8 daily per 100 shelter occupants.
By the end of the 3rd week they had fallen off, but already the
cumulative rate of injuries equaled that of the white population.
(Perhaps the blacks made up for their lack of access to their
properties, engaging in somewhat more frantic salvage operations, once
they were transported to Buras). Skin and wound infections in blacks
occurred at about twice the rate of that in the white population, and
tended to be grouped earlier. Diarrhea was rare, with most cases
appearing during the 3rd week.
The
black population (chart on the left)
had quite a different
pattern of illness. Initially, the respiratory infection rate increased
in the same manner as in the whites, but the epidemic continued, to
peak later, at about the l?th day. A. normal, rather than a bimodal
distribution, was assumed. Open injuries occurred at a very low
rate during the first two weeks. After the move to Buras, injuries
increased greatly, up to about 8 daily per 100 shelter occupants.
By the end of the 3rd week they had fallen off, but already the
cumulative rate of injuries equaled that of the white population.
(Perhaps the blacks made up for their lack of access to their
properties, engaging in somewhat more frantic salvage operations, once
they were transported to Buras). Skin and wound infections in blacks
occurred at about twice the rate of that in the white population, and
tended to be grouped earlier. Diarrhea was rare, with most cases
appearing during the 3rd week. 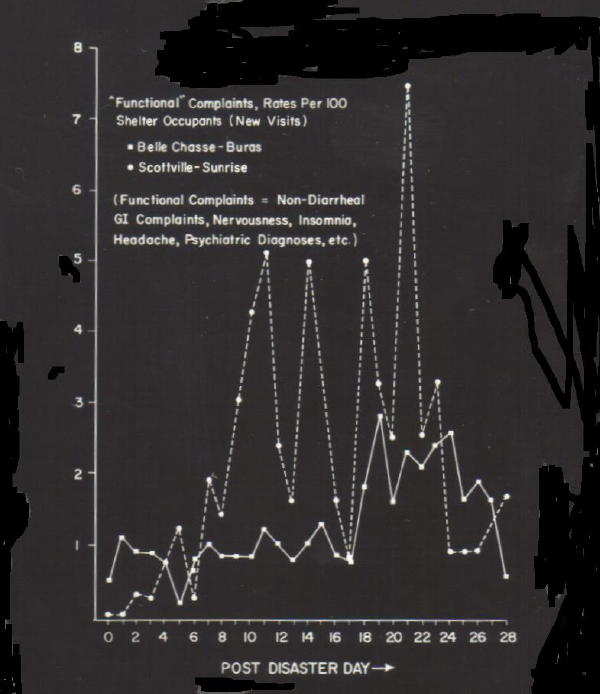 Finally,
there was an interesting difference in the pattern of so-called
"functional" complaints between the two groups. Functional
complaints are defined as non-diarrheal gastrointestinal complaints,
nervousness, insomnia, headache, psychiatric diagnoses, and the like.
As illustrated in the graph
to the left, the black population {the
broken line} considerably exceeded the white population in the
cumulative rate of these conditions. This difference was almost
entirely due to an excess of functional complaints in blacks, during
the second and third weeks. One might speculate whether these
differing patterns result from differences in the stresses experienced
by each group.
Finally,
there was an interesting difference in the pattern of so-called
"functional" complaints between the two groups. Functional
complaints are defined as non-diarrheal gastrointestinal complaints,
nervousness, insomnia, headache, psychiatric diagnoses, and the like.
As illustrated in the graph
to the left, the black population {the
broken line} considerably exceeded the white population in the
cumulative rate of these conditions. This difference was almost
entirely due to an excess of functional complaints in blacks, during
the second and third weeks. One might speculate whether these
differing patterns result from differences in the stresses experienced
by each group.